British Columbia, Canada
January 30, 2025
Like Google maps for your dinner plate, a new UBC project shows where 34 popular fruits and vegetables regularly consumed by Canadians come from.
Recently, several of Canada’s first ministers have encouraged people to buy Canadian products at the grocery store to counter potential U.S. tariffs. But just how much do we rely on imported fruits and vegetables, particularly from the U.S.?
Canada Food Flows, a new project from the University of British Columbia, can show you.
The interactive website maps, for the first time, the flow of 34 popular fruits and vegetables into and across Canadian provinces over 13 years, revealing in unprecedented detail how interconnected international and inter-provincial food systems are.
 Click the image to visit the Canada Food Flows website and see where Canadian provinces get their fruits and vegetables.
“Many fruits and vegetables are harder to grow in the colder Canadian climate. On average, about 50 per cent of vegetables besides potatoes, and 75 per cent of fruits eaten in Canada, are imported,” said Dr. Kushank Bajaj, a former UBC postdoctoral research fellow who created the tool. “Those are significant numbers. We hope Canada Food Flows can help Canadians understand where their produce comes from, and spark conversations about how things like climate change and trade policy could impact supply in the future.”
To create the dataset that powers Canada Food Flows, Bajaj combined data on production, imports and exports to estimate how 18 fruits and 16 vegetables were consumed and shared between 2010 and 2022.
The result is an interactive map showing how produce flows from U.S. states—which supply 36 per cent and 67 per cent of Canada’s total fruit and vegetable imports, respectively—and 149 other countries, as well as between Canadian provinces. The tool does not currently include data for Canada’s territories due to data limitations.
Build your own salad bowl with Canada Food Flows
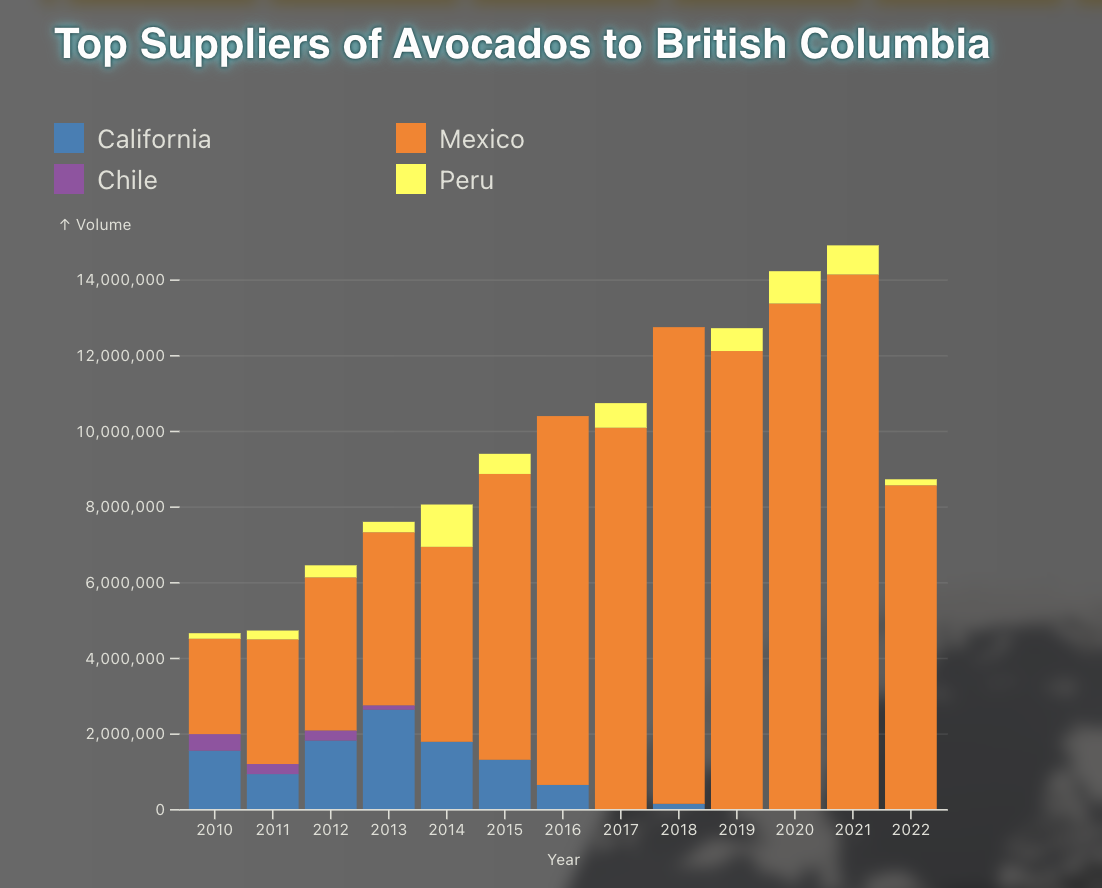
Take the ingredients for a simple summer salad: Canada Food Flows shows that in 2022, 81 per cent of B.C.’s spinach, 70 per cent of its lettuce, 31 per cent of its tomatoes and 75 per cent of its onions came from the U.S., while 97 per cent of avocados were imported from Mexico.
 The top suppliers of avocados to B.C., as revealed by the Canada Food Flows website.
Want strawberries for dessert? A whopping 92 per cent of B.C.’s strawberries came from the U.S. and Mexico, totaling over 31 million pounds.
In comparison, just 13 per cent of spinach, 24 per cent of lettuce, 16 per cent of tomatoes, 14 per cent of onions and no avocados were grown locally in B.C.
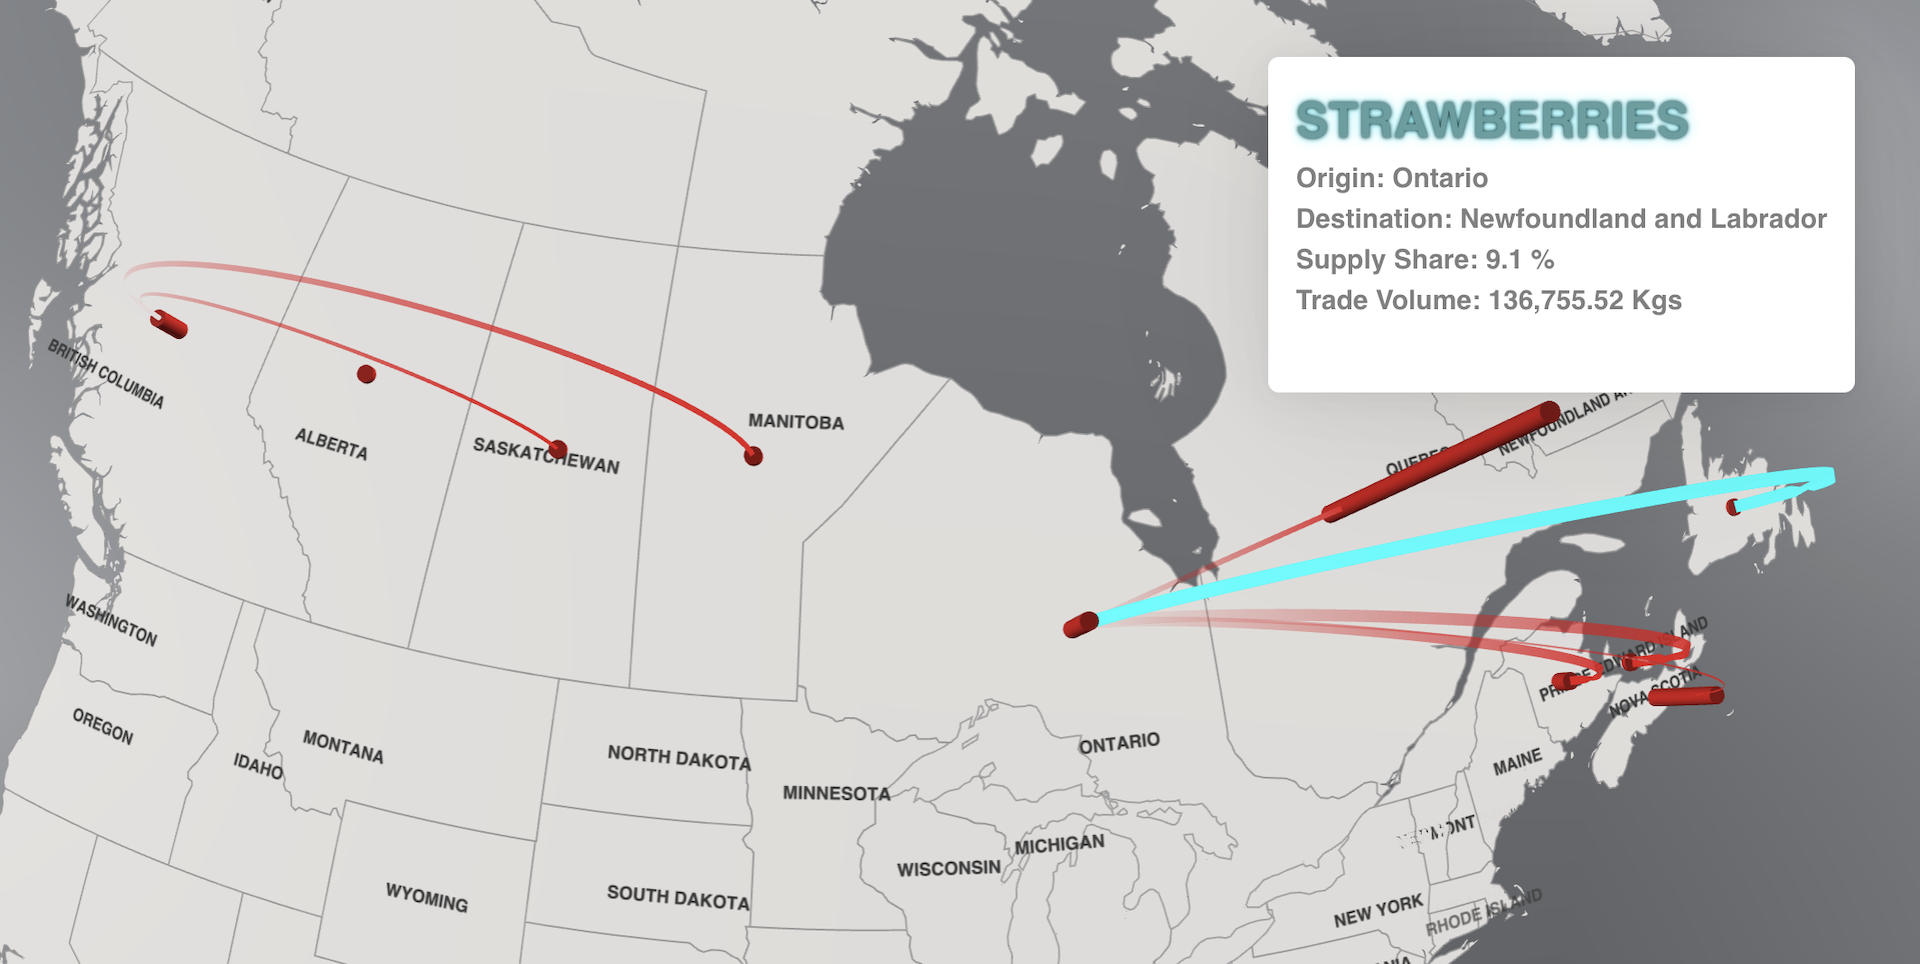
The website also shows how interprovincial trade plays a key role, enabling provinces like Ontario and B.C. to balance regional agricultural production and supply fresh produce to other parts of the country.
 The flow of strawberries between Canadian provinces.
“While eating locally can support sustainability and regional growers, Canada Food Flows reveals a more interconnected reality,” said Dr. Navin Ramankutty, co-creator of the tool and Canada Research Chair in Data Science for Sustainable Global Food Systems at UBC. “Canada is also a major supplier of produce like blueberries, mushrooms and greenhouse vegetables to the U.S. This two-way dependency underscores how tariffs or adverse climate events could impact food security and economies in both countries.”
Canada Food Flows grew out of Dr. Bajaj’s doctoral research on climate change risks to Canada’s fruit and vegetable supply and aims to empower policymakers, educators and consumers to make more informed food choices.
“We hope Canada Food Flows sparks further exploration of sustainability issues,” said Dr. Bajaj. “This dataset could be expanded to explore topics like the carbon footprint of food, greenhouse gas emissions from transportation, groundwater depletion, biodiversity loss and pollution from farming practices.”
Dr. Bajaj completed this work as a postdoctoral research fellow at the School of Public Policy and Global Affairs (SPPGA) and the Institute for Resources, Environment and Sustainability (IRES) at UBC. Dr. Ramankutty is professor and director of IRES and professor at SPPGA. The web application was developed by Edgar Ondati.